 Homatic.ai
Device analytics
Device analytics: see what your home has actually been doing
Every device you connect reports what it is doing, and Homatic keeps the history. Device analytics turns that history into answers: is the house OK right now, how long the AC really ran, when a sensor dropped off, and what “normal” looks like for each device.
Start free — no credit card Tour the views
Four places to look
1. The summary: is the house OK?
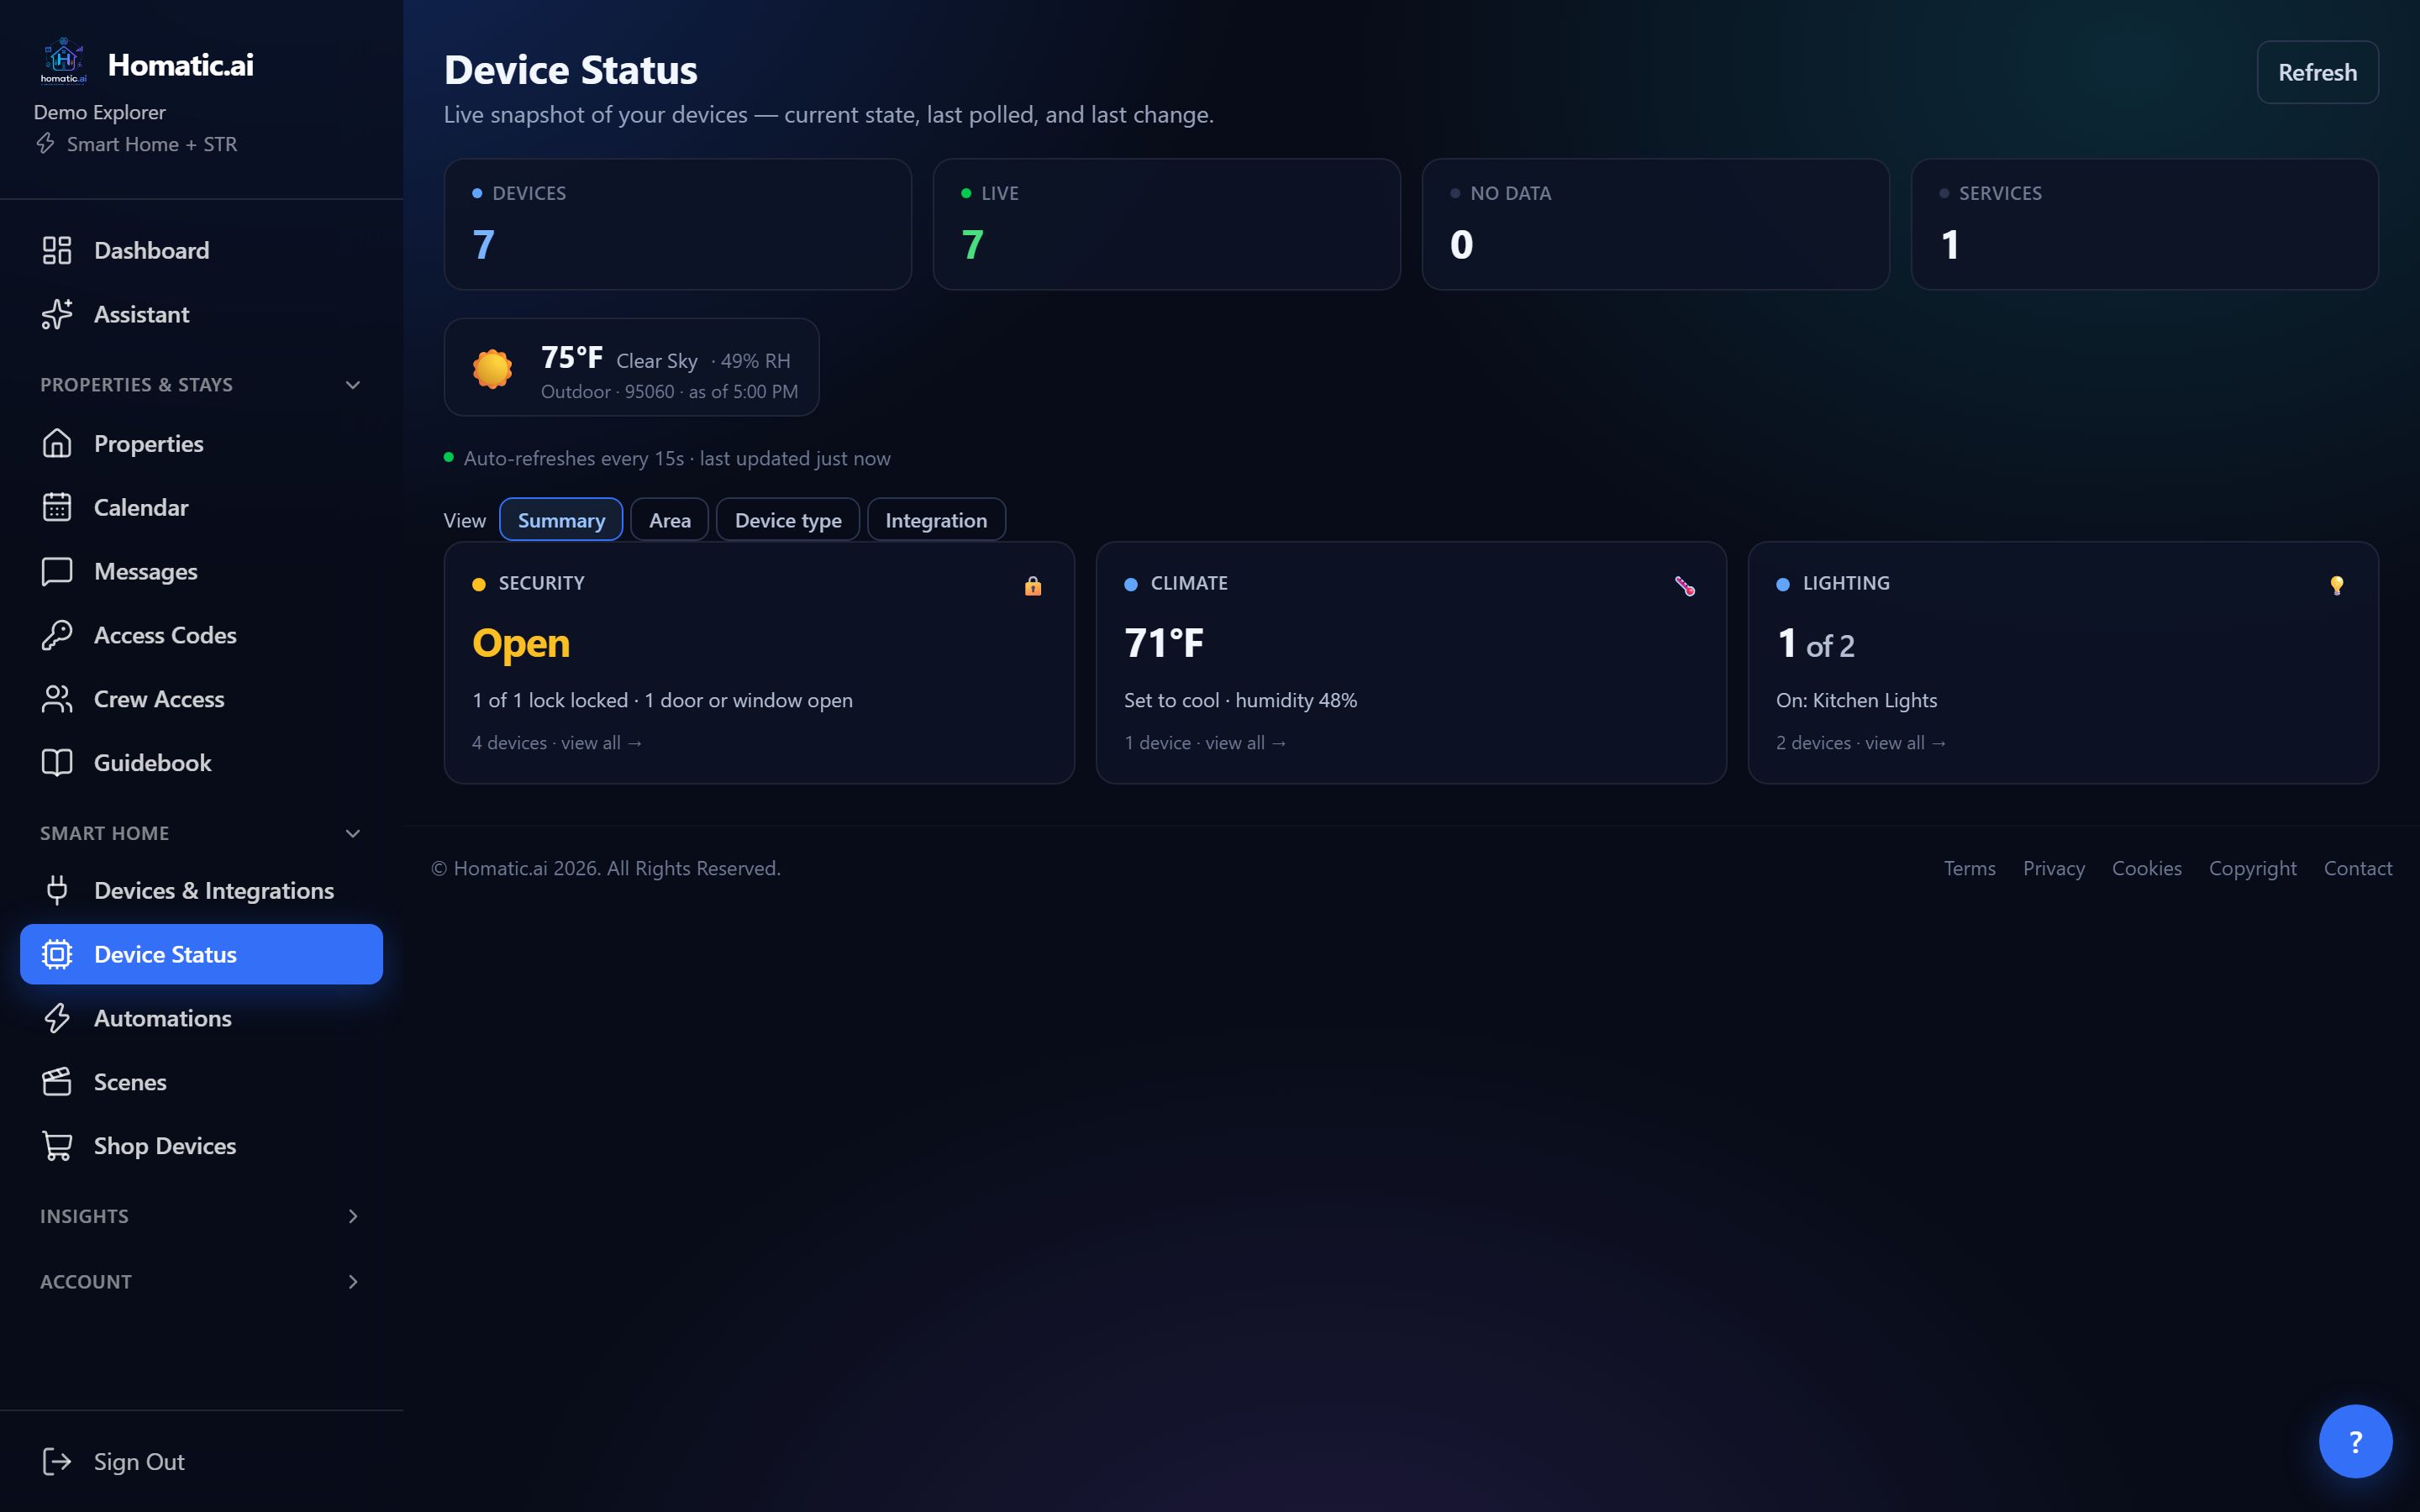
Open Device Status (under Smart Home). The default Summary view leads with alerts (smoke, carbon monoxide, water detected, a jammed lock, tampering, a closed water valve, low battery), each with View device. Below that is a tile for each system you have: Security, Climate, Lighting, Safety, Energy and Other. When nothing needs attention it says so, along with how many devices are reporting normally. The Area, Device type and Integration buttons switch to the detailed device cards.
2. A single device: is that normal?
On any device card, Details opens its history for the last 1d, 7d or 14d (leak sensors open on a week, because a quiet day is the normal case for them). Numbers such as temperature, humidity, battery and power are drawn as a small trend line. On/off states such as open/closed, wet/dry, locked/unlocked and motion are drawn as a timeline with totals, for example “open 2h 5m · 7×”.
3. Runtime & Uptime: how long did it run, and when was it down?
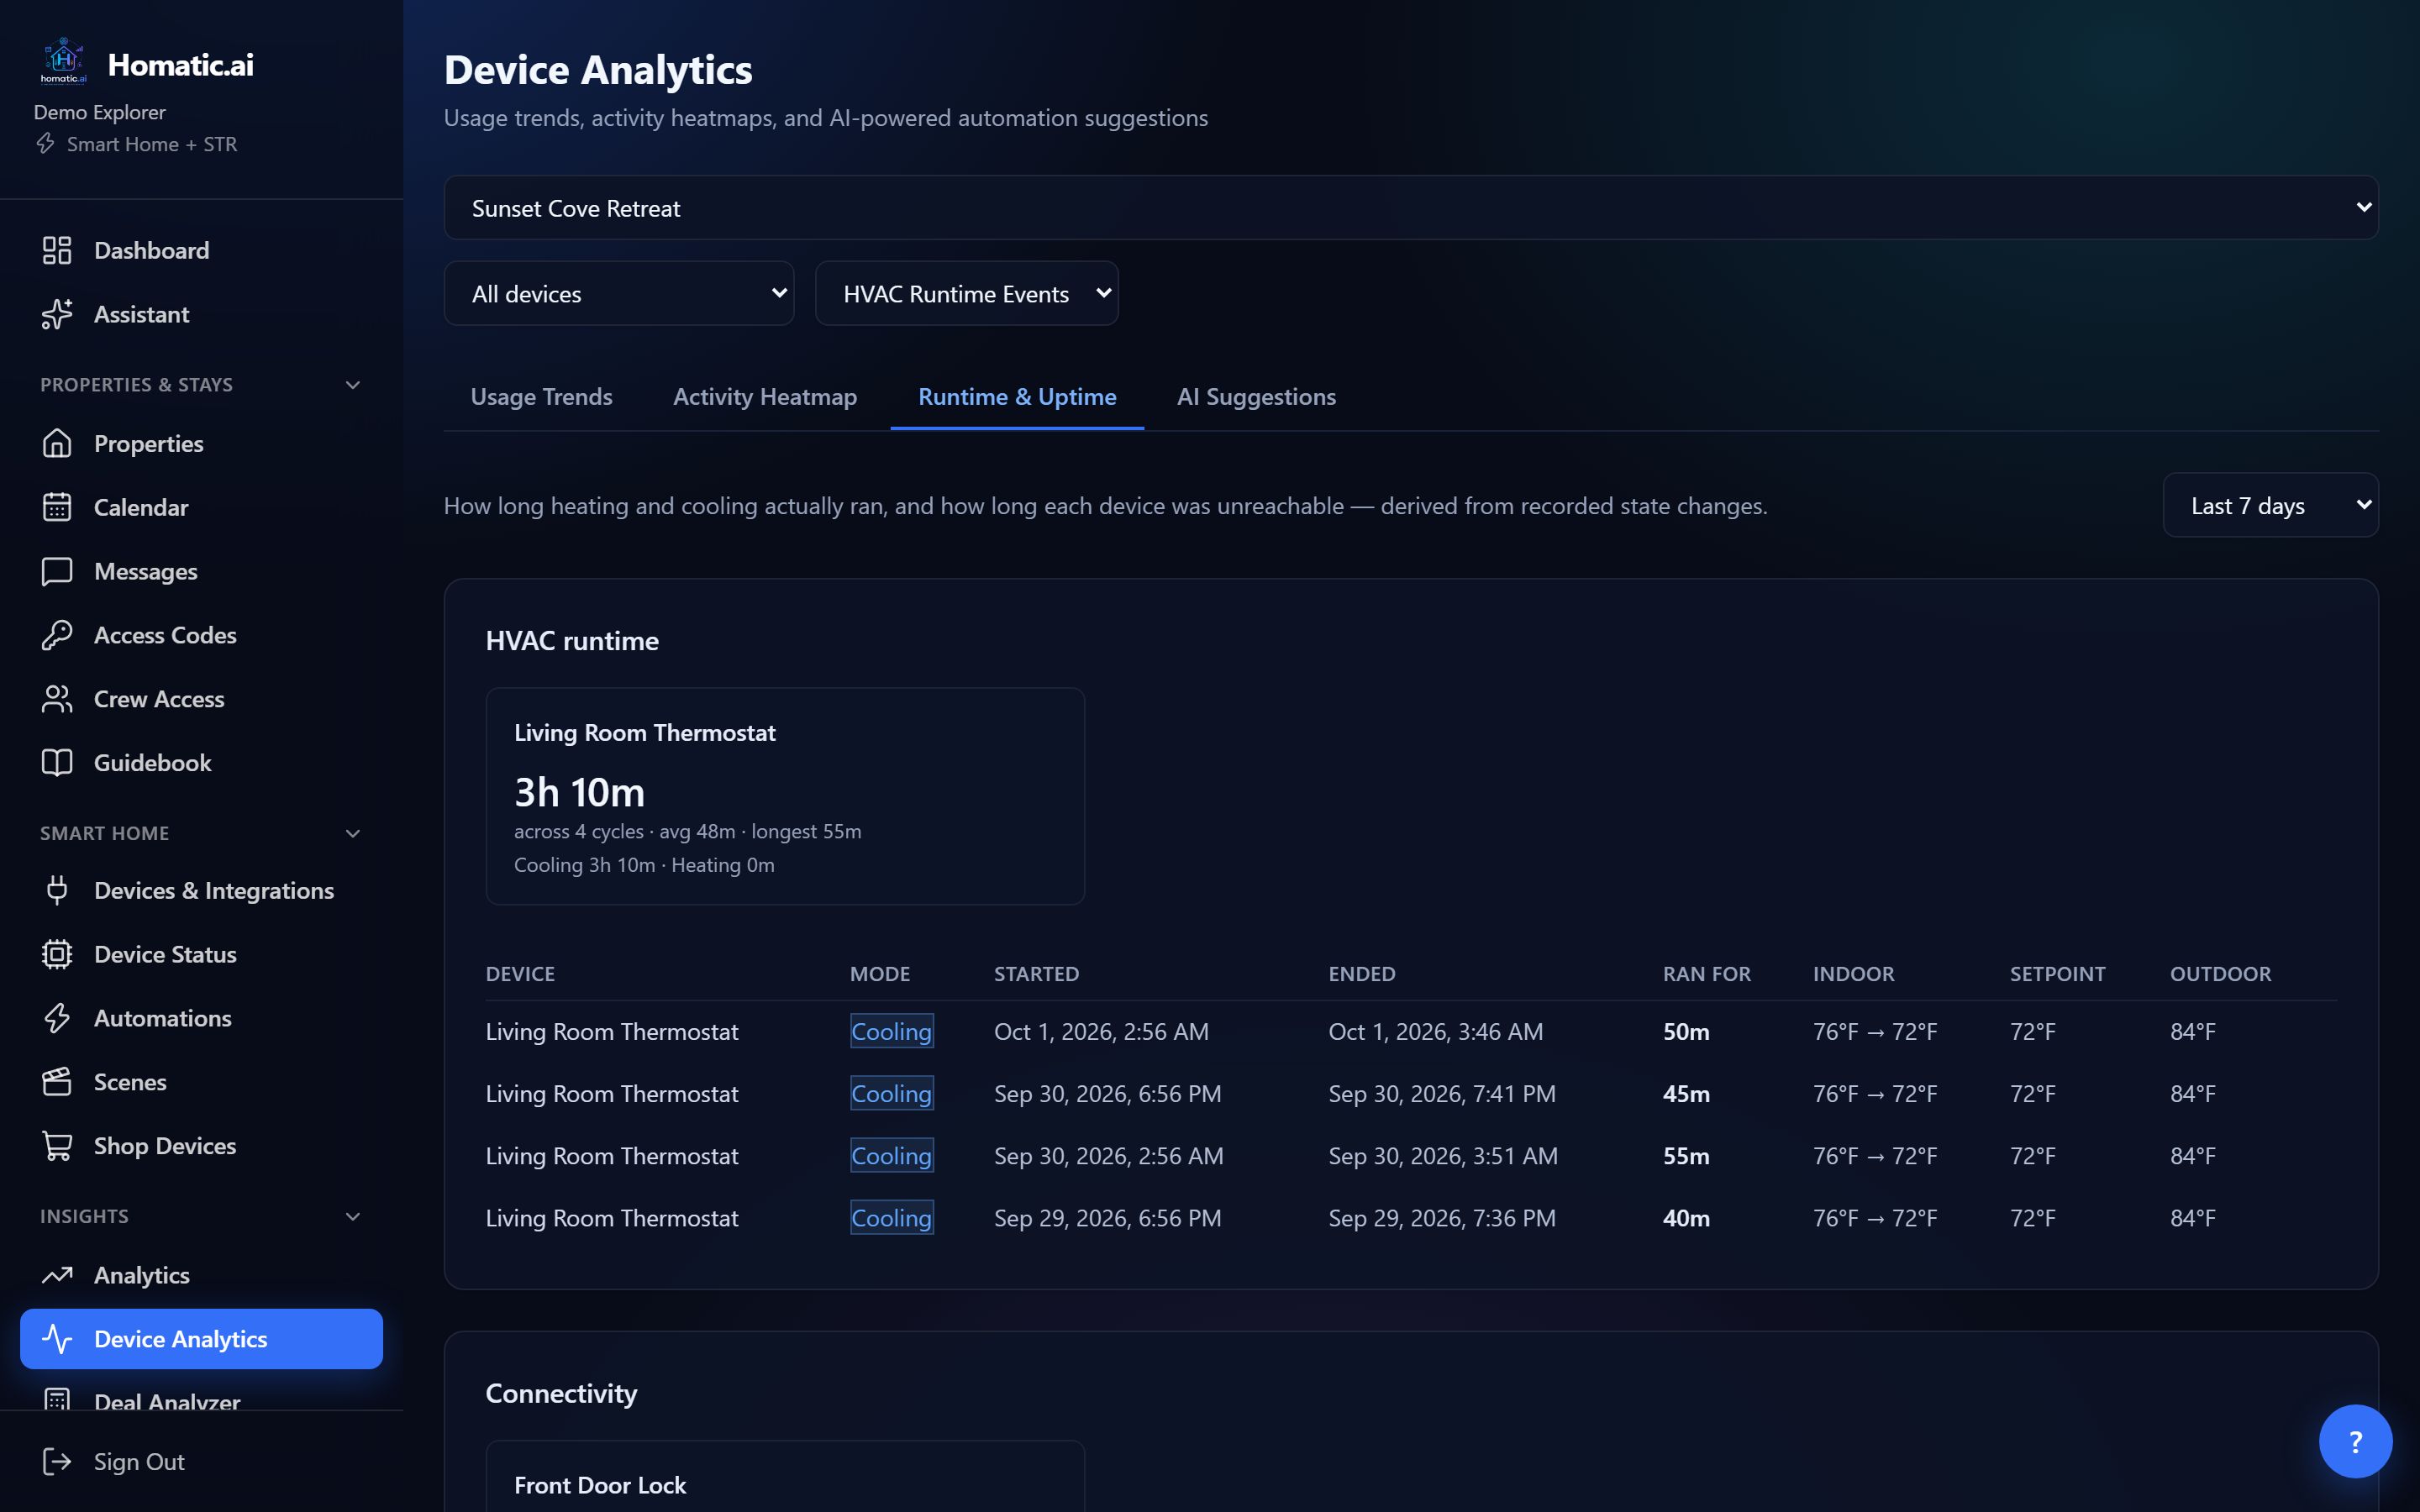
Under Insights → Device Analytics, the Runtime & Uptime tab answers the two questions hosts ask most:
- HVAC runtime: total time heating and cooling, the number of cycles, the average and longest, and a table of each run with when it started and ended, how long it ran, indoor temperature at start and end, the setpoint, and the outdoor temperature.
- Connectivity: how often each device was unreachable, for how long in total, the longest outage, and anything offline now.
Pick the last 24 hours, 7, 30 or 90 days.
4. Trends and the heatmap: the bigger picture
Usage Trends plots a metric (HVAC runtime events, motion, door openings or switch use) day by day for 90 days, against the outdoor temperature, so you can see whether usage follows the weather. Activity Heatmap shades each hour of each weekday over the last 30 days, so you can see when the house is busy. Choose one device or all of them.
See your own home’s history → Connect a property and the history starts filling in from the first reading.
How to read the numbers
- “At least” means a minimum. If a device stopped reporting in the middle of a cooling run, Homatic cannot know when the run ended, so the total is marked as at least that long rather than guessed.
- “Activity not reported” is not “idle”. Some thermostats never report whether they are actually heating or cooling. Homatic says so rather than showing them as idle.
- Quiet is not dead. A door that stays shut all night records nothing new, and that is normal. A device is only shown as having stopped reporting when Homatic can no longer reach it.
- “HVAC Runtime Events” counts starts, not hours. A six-minute run and a six-hour run each count once. For how long it actually ran, use Runtime & Uptime.
From history to action
History is most useful when it changes what the house does. The AI Suggestions tab proposes automations from your usage patterns, and the From this property panel on the Automations page points out things like a leak sensor no rule is watching or a lock left unlocked overnight on several nights. Both are covered in how Homatic suggests automations. You can also just ask the AI Assistant: “how long did the AC run yesterday?”
Which plans include it
Device Status, device history and Device Analytics are on every plan. AI Suggestions needs a plan that includes AI, which every paid plan does.
Common questions
Can I see how long my AC ran?
Yes. Device Analytics, Runtime and Uptime lists every heating and cooling run with its duration and the indoor, setpoint and outdoor temperatures, for up to 90 days.
How do I know if a device went offline?
The Connectivity section of Runtime and Uptime shows how often each device was unreachable, for how long, and anything offline now; the Device Status summary flags it too.
Is device analytics on every plan?
Yes. AI Suggestions, which proposes automations from your usage, needs a plan that includes AI.
See Homatic on your own properties
Connect a property and the dashboard fills in from your real devices — your locks, your thermostat, your calendar. Free for 30 days on Starter, no card required.